What's new in REW V5.30
V5.30 has moved to a new look and feel, FlatLaf, to modernise the appearance and make it easier to update. Besides the appearance change there is a lot of additional and changed functionality.
Pro version
Further control over averaging has been added.
- UMIK-X module averages are now available on the RTA
- Averaging groups have been added to the Configure Averages panel, allowing groups to be formed from any of the inputs
- There are check boxes for each input on the multi-input Adjust average dialog to provide a quick way to remove a measurement from the average (i.e. set its weighting to zero). If the mouse is over a check box when viewing a measurement the response for that input is shown on the graph
- There is an option on the input selection dialog to not generate an overall average of all the inputs for multi-input capture when the focus is the individual responses
Audio interface
- Sample rates up to 1536 kHz may now be selected on macOS. The desired rate for devices must also be selected in Audio Midi Setup (before starting REW). Successful operation at rates above 192 kHz may be hardware-dependent. An M1 mac mini has run without issues at 768 kHz
- The Output channel mapping now allows up to 16 channels to be mapped (was 8)
- There are separate dialogs for the soundcard preferences Check levels and Calibrate soundcard steps, as the buttons at the bottom of the help section were too easily missed
Sweep measurements
There is now a mode selector for SPL measurements with a choice of Single measurement, Repeated measurements or Sequential channel measurements. Sequential channel measurements allows a selection of channels to be measured one after another.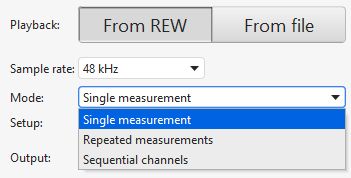
There is a Setup button below the mode selection which brings up a list of settings to apply, including a start delay before the measurement starts, a delay to use between repeated or sequential measurements, the number of repetitions for repeated measurements and the channels to measure for sequential measurements.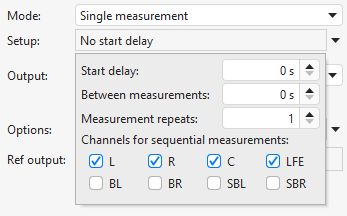
A number of options have been added to allow faster measurement.
- There is now a 64k sweep option for faster response measurements at sample rates of 48 kHz or lower
- The approximately 1 second of dither played before a measurement sweep is now optional
- Noise floor capture before a sweep measurement is also now optional. Capturing the noise floor takes about 1.4 seconds
Other measurement-related changes include:
- There is now a naming option to prefix the measurement name with the output channel
- There is now an option to reduce the sweep level by 10 dB when measuring the LFE channel. For Java drivers that means the channel name is LFE, for ASIO drivers it is assumed to be the 4th ASIO output channel if there isn't an output name containing "LFE".
- There is now an option to use a different sweep end frequency when measuring the LFE channel. For Java drivers that means the channel name is LFE, for ASIO drivers it is assumed to be the 4th ASIO output channel if there isn't an output name containing "LFE".
- There is now an option to "Fill silence with dither" when measuring to try and defeat aggressive muting by some DACs when one channel has no data
- A wired timing reference mode for file playback, allowing the timing reference input to be on a different channel to the measurement input
- Import sweep recordings can import all channels of a multi-channel response recording, creating individual measurements from each while preserving their relative timing. The first channel of the response is searched for the acoustic timing reference signals.
- Noise floor data is extracted from imported sweep measurements if there is sufficient data before the timing reference (about 2 seconds is needed)
- The maximum clock adjustment is now 400 ppm, a warning is shown if the clock adjustment is more than 250 ppm as it is likely due to dropouts in playback or capture rather than clock rate differences
- Noise and distortion levels are now calculated for sweep measurements and displayed in the Info window
- Noise and distortion are checked when sweep measurements are made and a warning is shown if either is too high
EQ
The EQ filters panel layout has changed to a horizontal format with an image of the filter response in the select button and controls that can be revealed with left click and hidden with double click or right click.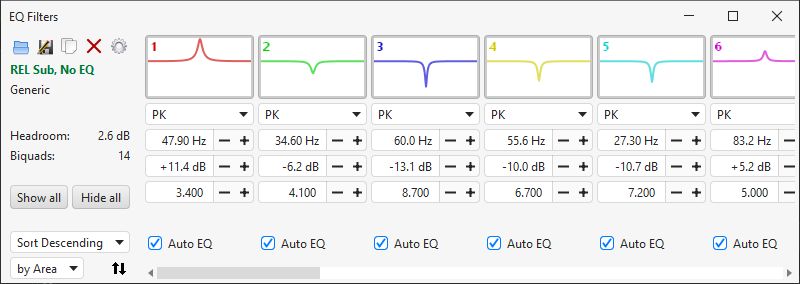
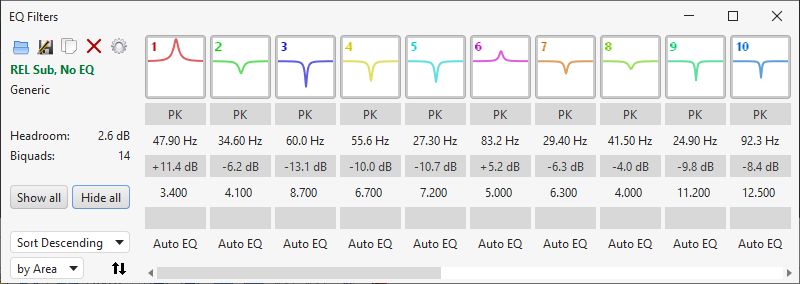
Other features of the new layout include:
- If the mouse is over a set of filter controls the response of the filter will be shown highlighted on the Filter adjust graph
- Values in spinners and drop down boxes can be changed by using the mouse wheel, whether the controls are visible or hidden. Holding the Alt key while scrolling the mouse wheel provides fine adjustment
- The value controls can have side-by-side plus and minus buttons (easier to adjust) or one above the other arrow buttons (more compact)
- The open and save file buttons on the EQ filters panel use the equaliser's file format if it supports both loading and saving, otherwise REW's .req format is used.
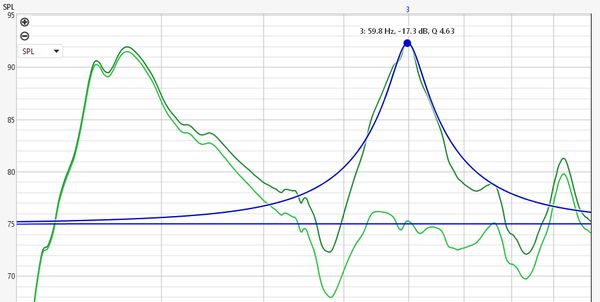
The filter adjust graph shows the region selected for correction by fading the graph outside that region. It has a "Graphical filter edit" option which shows circular handles at each filter's centre frequency. The colour of the handles matches the colour of the filter in the EQ filters panel.
- Gain or frequency can be adjusted by clicking and dragging on the handle
- Q can be adjusted by placing the mouse over the circular handle and using the mouse wheel. For fine Q adjustment hold the Alt key while moving the mouse wheel
- The response of the filter is highlighted when the mouse is over the filter's handle
Equaliser selection is now split by manufacturer and model as the list was becoming unwieldy:

The Generic, Extended and miniDSP equalisers have gained a Linkwitz Transform filter option and there are a number of new equaliser choices:
- d&b audiotechnik tuning filters
- CamillaDSP IIR filters with export to and import from YAML files
- Hypex Input EQ
- JRULTR subwoofer EQ
- Mosconi Channel EQ (9-band) and Main EQ (30-band)
- Grace Design m908 EQ with export to and import from CSV files
- Audiotec Fischer Full EQ (30 bands), Half EQ (15 bands), Input EQ (7 bands) and EQ with TC (27 bands)
- An "Extended" generic equaliser option with 20 filters which can each support a range of high order types including low pass, high pass and shelf filters with slopes up to 48 dB/octave
- A "Configurable PEQ" generic equaliser option with configurable number of filters, freq span, gain range and Q or bandwidth range
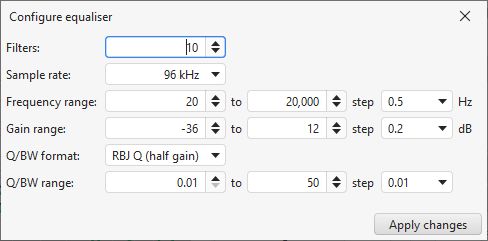
Max Q for the Emotiva RMC-1 equaliser entry has been reduced to 10 to reflect current RMC-1 and XMC-2 capabilities
Below the main filter adjust graph there are some new graph choices: a group delay graph, showing the measured and predicted group delay, and step responses on the impulse graph.
House curve file selection is now in the Target settings of the EQ window instead of in a preferences panel.The Target settings room curve slopes can be up to +/-12 dB (previously +/-6 dB).
Impulse responses
There are a number of changes to the display and handling of impulse responses. A navigator view below the impulse graph shows the entire response with the currently displayed portion highlighted. The highlighted region can be dragged to reposition the view. Clicking anywhere in the navigator view centres the displayed portion on the click. If the mousewheel is used while the mouse is over the navigator the graph will be zoomed along its time axis, centred on the time axis position of the mouse pointer in the main graph. The navigator replaces the scrollbar, if it is turned off (in the graph controls) the scrollbar will be visible again according to the state of the scrollbars button above the graph. An indicator ("T") at the bottom of the impulse graph shows the position of the timing reference when the measurement was made.

The Impulse graph controls now have a button to scale the IR data to apply a specified gain or achieve a desired peak value.
The IR windows dialog has some additional buttons to apply the window selections to the measurements selected in the All SPL or Impulse overlay graphs. Changes to the window settings in the dialog are applied as they are made. There are also additional window shapes: Cosine, Tukey 0.5 and Tukey 0.75. The choice of cycles or octave fractions for the frequency dependent window units is now in the Analysis preferences,
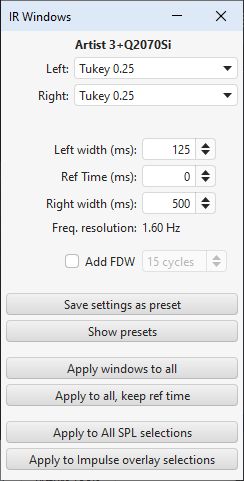
The windows dialog now allows a set of window presets to be defined. Presets are created with a Save settings as preset button on the dialog and applied by selecting them from the presets panel.

The impulse overlay graph has gained fractional octave filter controls to allow all selected impulse responses to be filtered at once. It also has a "Remove IR delay" button which estimates IR delay and shifts the IR to remove it for all selected measurements.
All SPL graph and its tools
There are a few additions in the All SPL graph control set:
- The alignment tool now has a choice of phase or impulse alignment modes. Impulse alignment mode uses cross-correlation of 1/3 octave zero phase filtered impulse responses
- A Cross corr align button has been added, which time aligns the currently selected measurements by cross correlation of their windowed impulse responses, using the first of them as the reference. This may be useful to align measurements from a mic array or measurements of the same source from different positions prior to vector averaging
- Trace arithmetic now has an operation to divide the magnitudes of traces
- Trace arithmetic now has operations to invert magnitude (zero phase) and to invert phase, both can be restricted to a specified frequency range
- There is now has a measurement action "Trim IR to windows" to make a copy of a response with an IR whose length is the smallest power of 2 that covers the windowed span
- Averaging measurements averages their distortion data if they cover the same frequency range at the same resolution
- There are two new averaging options, RMS + phase and dB + phase, which augment an RMS or dB average with phase data from a vector average
- There is a "Remove IR delays" button to remove the estimated IR delay from all selected measurements which have an IR
Spectrogram and Waterfall
Generation of waterfalls has ben made faster on system with multiple processor cores. There are also a few new features in the spectrogram and waterfall graphs:
- Airy and Morlet continuous wavelet transform modes have been added to the spectrogram graph
- There are export buttons for the decay, waterfall and spectrogram graphs to export the time-frequency data as text
- An "Iron" colour scheme has been added
- The minimum frequency for waterfalls and spectrograms is now the axis start frequency set in the View preferences rather than 10 Hz
The Airy CWT and Morlet CWT modes are Java implementations of a continuous wavelet transform using the algorithm described in Arts, L., & van den Broek, E. (2022). The fast continuous wavelet transformation (fCWT) for real-time, high-quality, noise-resistant time–frequency analysis. Nat Comput Sci, 2(1), 47–58. https://doi.org/10.1038/s43588-021-00183-z
The Morlet wavelet is commonly used for CWT, though it has some deficiencies at high time resolutions, producing artefacts which are a consequence of it being only approximately analytic. The Airy wavelet is from the γ = 3 family of the generalised Morse wavelets. It is exactly analytic and has better performance than the Morlet wavelet at octave fractions from 1/1 to 1/5. At high frequency resolutions, octave fractions from 1/12 to 1/24, the Airy wavelet produces artefacts and the Morlet wavelet is a better choice.
REW's existing Wavelet mode implements the transform using complex smoothing and the time shift properties of the FFT, with a kernel that is less Gaussian (tending more towards triangular) than Morlet or Airy. That gives sharper definition to higher level features of the plot at the expense of more low level artefacts.
RT60
RT60 analysis has gained some features, primarily around averaging:
- There is a button in the Overlay RT60 graph controls to export the average of the selected traces
- There is a "Show ISO3382 average" option on the Overlay RT60 graph to show the average of the chosen ISO3382 parameter for the selected traces
- An "Export all data" button has been added on the Overlay RT60 data graph to export all RT60 data for the selected measurements
- There is now a grouping selector when exporting RT60 data from multiple measurements to allow grouping by measurement or by parameter
- RT60 and impulse filtering choices are made via a combo box instead of check boxes for reverse or zero phase filtering
RTA
The RTA has a few updates:
- A display of voltage gain has been added to the RTA THD info panel when the signal generator is playing a tone, it is only meaningful if the input and output voltages have been calibrated
- Figures for SNR and ENOB has been added to the RTA THD info panel
- Measurements saved from the RTA with data in the distortion panel can show the distortion panel on the SPL & Phase graph
- The spectrum peak value for tone burst signals is now labelled in the units of the RTA graph Y axis rather than being fixed as SPL
- A button has been added in the RTA image capture dialog to insert the RTA settings in the graph comment
- The stepped sine dialog replicates some distortion settings for convenience
- The stepped sine dialog has a Settling time control for each test type to accommodate components in the measurement chain which require additional time to settle after the stimulus changes
- There is now an option to go back one step and use a smaller step size if the distortion limit is exceeded during a stepped level test, allowing the limit to be determined more precisely
- The RTA distortion settings now includes options to choose whether and how many harmonic levels are shown in the distortion data panel and whether the higher harmonic distortion level is shown
- The RTA distortion settings now have a setting for the highest harmonic to include in the calculated THD figure
- The RTA trace can be filled
- The RTA controls now have an option for whether the fundamental frequency is obtained from the generator instead of the input signal when playing a sine tone
- Coherent averaging is possible when playing a tone burst or CEA-2010 burst from the signal generator with an interval which matches the FFT length when FFT overlap is set to 0%
- Forever averaging can be configured to stop the RTA when a chosen number of averages is reached
Data import and export
There are a number of import/export changes beyond those already mentioned:
- Export impulse as wav has an option to place t=0 at a specified sample index, default is 256
- Export IR as WAV has an option to export a specified number of samples
- Export Filters IR as WAV has options to export a specified number of samples and place t=0 at a specified sample index
- When exporting an impulse response as WAV without windowing or setting t=0 at a specified sample index the peak is no longer placed at 1 second but left wherever it appears in the raw data
- Import impulse response accepts ARTA .pir files
- Analysis preferences has an option to place t=0 for imported IRs at sample 256, so exports/imports with t=0 at sample index 256 will preserve t=0 timing
- There is an option to import all channels when importing audio data
- Multiple selection is now possible in the file dialogs for import frequency response and import impulse responses, though drag and drop may be easier.
- Comments and headers can be omitted when exporting measurements or impulse responses as text
Preferences
The default storage for preferences is system-dependent, in the registry on Windows, for example. With this new release REW can instead use a file for its preferences. There are three ways to configure that:
- The easiest is to put a file in the REW log files folder with the name rewprefs.txt. If that file is found on startup REW will read preferences from it (if it has any) and use it to store all preferences
- To use a different file launch REW with a -prefs argument with the path to the file, for example a Windows shortcut target like "C:\Program Files\REW\roomeqwizard.exe" -prefs "C:\Users\johnm\Documents\myrewprefs.txt"
- The final option is to make a -Drew.preferences.file entry in the roomeqwizard.vmoptions file specifying the path to the preferences file
The -prefs argument is checked first, then the -Drew.preferences.file entry and finally REW looks for rewprefs.txt. Switching to file-based preferences can be done quickly by saving preferences to rewprefs.txt in the log files folder using the new Save preferences to file entry in the Preferences menu and restarting REW. On Windows systems startup is a little faster with file-based preferences.
It is also possible to make REW begin with a particular set of preferences when it starts up. As with the preferences storage file, there are 3 ways to specify an initial set of preferences to use:
- Put a file called initialprefs.txt in the log files folder
- Launch REW with a -initialprefs argument specifying the path to the file
- Make a -Drew.initialpreferences.file entry in the roomeqwizard.vmoptions to specify the path to the file
The -initialprefs argument is checked first, then the -Drew.initialpreferences.file entry and finally REW looks for initialprefs.txt. If a preferences file has also been specified REW will copy the initial preferences to that file, if not it will create a preferences file and copy the initial preferences into it. The initial preferences file will not be modified.
Interface
There are a variety of additions and changes to the user interface:
- There is a graph Actions button next to the graph Controls button for graphs which have actions to carry out on the data, including all the Overlay graphs, the SPL & Phase graph and the Impulse graph. The Actions button shows a panel with the action buttons and controls on it that can be repositioned, reducing clutter on the graph by taking those actions out of the graph controls panel.
- When a measurement is selected its trace may highlighted on any displayed overlay graph if the Highlight current selection on overlays View preference is selected
- Clicking on the panel for the currently selected measurement toggles trace highlight on any displayed overlay graph if the Highlight current selection on overlays View preference is selected
- A Ctrl+H shortcut toggles trace highlight for the currently selected measurement on any displayed overlay graph
- Measurements can be disabled or enabled by right clicking on the measurement's thumbnail. Disabled measurements cannot be selected, are skipped when using the next/previous measurement shortcuts (Alt+up/down and Ctrl+up/down) and are not shown in the legends of overlay graphs. All measurements can be re-enabled via an entry in the right-click menu of graph legends or using the Ctrl+E shortcut. All selected or all unselected measurements can be disabled via entries in the right-click menu of overlay graph legends. The Ctrl+D shortcut disables the currently selected measurement.
- Measurements can be locked or unlocked by right clicking on the measurement's thumbnail. Locked measurements cannot be deleted, the delete button icon is replaced by a padlock. All measurements can be unlocked via an entry in the right-click menu of graph legends or using the Ctrl+U shortcut. The Ctrl+L shortcut locks the currently selected measurement. All selected measurements can be locked via an entry in the right-click menu of overlay graph legends. The Actions panels for overlay graphs have buttons to lock or unlock the currently selected measurements.
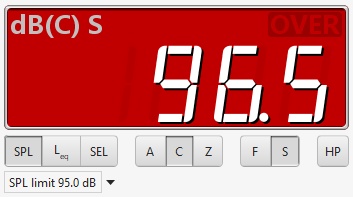
- The SPL meter can change its background colour to show when a limit is being approached or has been exceeded
- The graph axes can be zoomed and their limits adjusted using the mouse wheel by moving the mouse over the axis you want to adjust. Placing the mouse at either end of the axis allows the axis limits to be changed, placing it elsewhere along the axis allows zooming in or out centred on the mouse position. Hold the Alt key for fine adjustment.
- The right hand Y axis labelling is no longer tied to the left hand Y axis grid lines
- An indication is shown if a highlighted trace is above or below the graph range
- The mouse wheel can be used to adjust all spinners and drop-down boxes when the mouse is over the control (with a View preference to disable that if preferred)
- The mouse wheel can be used to adjust sliders for the alignment tool and t=0 offset
- Holding the shift key when using the mousewheel zooms the graph in the x axis only
- There is a View preference for which traces are selected when Overlays graphs first open, all or just the current measurement
- The legend panel right click menu for overlay graphs has an option to replicate the All SPL graph selections
- The legend panel right click menu for overlay graphs has an option to copy the selections to the other overlay graphs
- There is a Fit Y to data button on the extents dialog and a Ctrl+Alt+Y shortcut to fit the Y axis to the data extents on graphs with a frequency X axis
- Double-click on a graph brings up the Limits dialog
- The SPL & Phase, All SPL, Overlay SPL, Overlay Predicted SPL and Impulse graph magnitude graphs have an IEC 263 aspect ratio control to force them to a preferred ratio. If a ratio is selected the margins around the graph will be adjusted to achieve the specified dB/decade. At very narrow frequency spans the margins will be prevented from growing too large and the aspect ratio can no longer be maintained, the actual aspect ratio can be shown on the graph by selecting that option in the View preferences.
- Controls have been added to set the minimum and maximum SPL of the room simulator graph
- The distortion graph percentage legend values switch to scientific notation below 0.0001% instead of 0.001%
- When the distortion graph Y axis is dBr show the equivalent major percentage figures on the right hand side
- The scope channel settings and trigger settings panels are now dialogs that can be repositioned and left visible
- There is now an option to show the data points for stepped level measurements on the distortion graph
- Ctrl+Up and Ctrl+Down select the previous or next measurement, in addition to Alt+Up and Alt+Down
- The Info panel is now resizeable
- There is now a checkbox in the generator playback panel to choose whether the signal should also be sent to the timing reference output. This setting does not affect sweep measurements, only the generator behaviour when not measuring.
- Trace options now include a thick stroke choice
- The default trace colours have been adjusted for the new themes, they can be applied by using "Reset to REW defaults" on the default trace colours dialog in the View preferences. The previous defaults can be re-applied instead by using "Reset to V5.20 defaults"
Bug fixes
Finally, there are a number of bug fixes:
- Fixed: The IMD TD+N figure omitted contributions after the highest test frequency in the IMD signal
- Fixed: The IMD DIN overall calculation used d2L and d3L twice instead of d2L, d2H, d3L and d3H
- Fixed: Voltages in the full scale voltage fields would be parsed incorrectly if their units were not V, mV or uV
- Fixed: RTA distortion panel N figure read low when the fundamental was close to the noise floor
- Fixed: Names of highlighted traces could show an html opening tag
- Fixed: Null pointer exception when importing sweep recordings
- Fixed: input volume control could be briefly enabled on macOS after selecting an input
- Fixed: FDW data could have a fractional sample offset after some trace arithmetic operations
- Fixed: Imported frequency responses converted to min phase were shifted by -3 dB
- Fixed: Cal files were not applied to burst decay plots
- Fixed: NPE on captured graph
- Fixed: Saving multi-channel RTA captures to individual measurements would cause an exception for more than 2 inputs
- Fixed: Stepped sine THD measurements vs frequency could plot harmonics beyond their valid range
- Fixed: The frequency band header could appear on stepped level measurements
- Fixed: Only apply the Analysis preference to add FDW to measurements when they are made
- Fixed: Ensure dialogs are fully visible when they are displayed
- Fixed: High 2nd harmonic distortion could cause IR start time to be set too early due to treating the harmonic image as part of the IR
- Fixed: Selecting another measurement when the spectrogram Y axis was frequency could reset the frequency span
- Fixed: WAV files shorter than the FFT length dropped on the RTA caused an exception
- Fixed: WAV files dropped on the RTA could show artefacts at around -162 dB
- Fixed: The macOS installer would only run in Light mode on Ventura
- Fixed: The WASAPI Exclusive Java driver might not generate an output with some devices
- Fixed: The ASIO Int32LSB24 input format (used by Marian interfaces) was not handled correctly